
Pave The Way To Predictive Customer Interactions
An essential component of Customer Success is the ability to regularly take your customers’ temperatures and look for signs of their health through a robust health scoring program.
Can your organization confidently answer the following questions: Is the customer experiencing difficulty with certain features of your product? Has the customer stalled in their usage? Is the customer a good candidate for upsell opportunities or are they at risk of churning? Without clear and complete answers to the above, your organization may be failing to recognize signs of churn risk and proactively steer customers on the track back to adoption, renewal and expansion.
Good news: there’s a proven and powerful solution! An optimized customer health scoring strategy will empower your organization to make predictions about your customers and how your relationship with them may change in the future, enabling you to be more proactive in your interactions. In this article, we uncover a fool-proof predictive customer health scoring framework to help you maximize value realization and drive adoption, retention and expansion throughout the entire customer journey.
1. Collect The Right Data Throughout The Customer Lifecycle
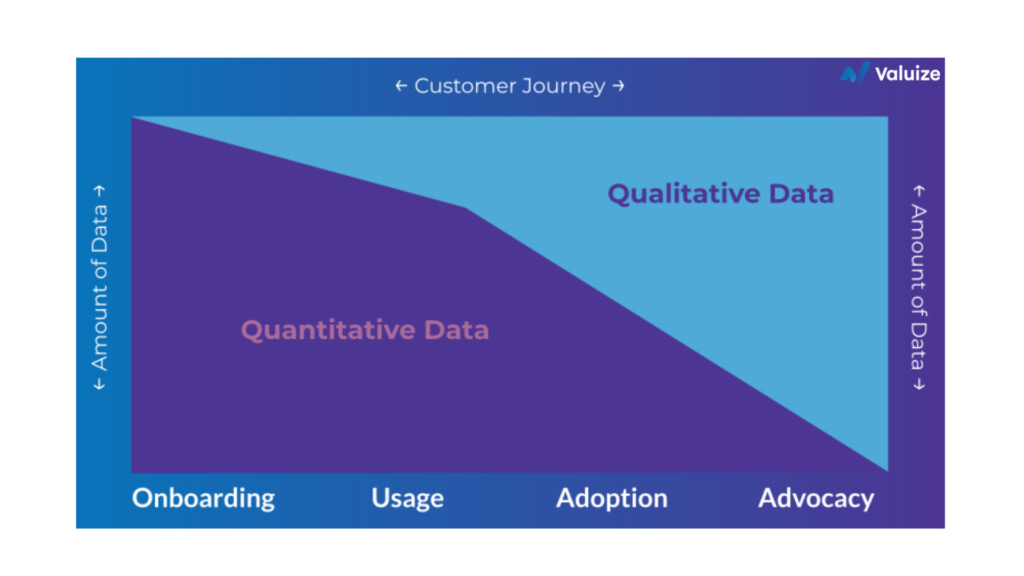
As your customer moves through the different stages of the customer lifecycle, the data you need, and the story that data may tell you, will be different. When a customer starts their journey with you, you’re going to have access to plenty of quantitative data and limited qualitative data. As the customer progresses in their journey, the amount of qualitative data will continue to increase so that by the time you get to advocacy, you’ll be relying on qualitative data almost exclusively. It’s important to keep these realities in mind as you determine what your key metrics are because your customers’ lifecycle stage will place constraints on the kind of data you can collect and the insights you can extrapolate.
Understanding where your customers are in their journey will also allow you to segment them accordingly for more effective data analysis. While many leaders assume they need to know every minute detail of their customer lifecycle and account for every subsequent data point, what you really need to identify are big bucket items and big bucket differentiators.
To begin this process, the first and easiest step is to leverage your quantitative data. Can you identify when the customer has moved from onboarding to actually using the product? Can you determine when the customer goes from using the product to being at steady-state adoption? Based on the customer’s qualitative data, can you pinpoint when they’ve reached advocacy? These are key stages with huge differentiators that you need to be tracking. To help move your customers along this journey, we recommend that you set up checkpoints that capture this quantitative and qualitative data. Ultimately, you want to reach a state where your organization can accurately map your data and customer behaviors to these big bucket differentiators; this ability is the vital first step in getting more predictive with customer health scoring.
2. Create & Test Your Hypothesis
Not all data is created equal, and not all data is important. Once you have operationalized an effective data collection program, create a hypothesis to help you definitively determine what data is actually relevant, valuable and actionable to help you analyze, understand and improve your customers’ experience.
It can be helpful to start with a business question such as “Can we tell when a customer is likely to churn?” This question may be unanswerable, but it can guide you to your first set of hypotheses. Your hypotheses should be grounded in the customer’s data and the customer’s perspective. You might begin with this hypothesis: “Because our product relies on users to regularly log in to get value, we hypothesize that low monthly average logins will correlate with customers churning.”
We recommend starting with 4-6 data-driven hypotheses. In order to reject (or fail to reject) these hypotheses, you will need to match your product data back to your Salesforce or CRM data so you can segment your customers into cohorts. Your CRM data should be able to answer the following questions:
- Who is the customer?
- When did their contract start?
- How long have they been a customer?
- When did their last event happen?
- Was their last event an initial purchase, a renewal, an expansion or did they churn?
- Has that customer churned?
Once you decipher your most relevant data points and apply them to your data model, you can bucket your customers into cohorts, either by spend or some other demographic information such as how long they’ve been a customer, whether they’ve churned or whether they’ve expanded. This process will enable you to accurately compare similar customers and analyze the data strategically.
3. Analyze Your Data Strategically
While there are sophisticated and advanced methods of data analysis, sometimes the best way to get started is to simply run the data through a spreadsheet. Collate all of your information in an Excel file and find the basic averages, outliers, median, mode and standard deviation of a dataset to understand where your thresholds are (bonus points if you can gather insights through methods like a regression analysis). The goal is to uncover directional significance so that you can help your team focus their energy on driving value for at-risk customers and focusing expansion energy on customers who are maximizing their usage.
As you embark on this health scoring analysis, you need to clearly outline which method you’re going to use to qualify each insight or “measure”. Insights can be defined through a number of methods including:
- A binary analysis – does the customer’s data indicate a particular attribute existing or not?
- Trend line analysis – is the customer’s data trending up or down?
- Threshold analysis – is the customer’s data above or below a certain threshold (as defined by “healthy customer data” in their cohort)?
After this initial analysis, your next step is to develop an easy-to-interpret scale to make your customer health scoring meaningful and useful. This scale also makes it easy to distinguish between customers who could use more support and customers who could expand their use cases. For example, on a scale of 0-100, anyone who scored 0-39 is labeled unhealthy; anyone who scored 40-79 is labeled at risk; and anyone who scored 80-100 is labeled healthy. Using a Customer Success platform like Gainsight, you can also assign colors to these scores, such as red, yellow and green for unhealthy, at-risk and healthy.
Keep in mind, it isn’t enough to collect and look at a data point in isolation. You need to specifically outline what good and bad looks like so that your team can take action to provide corrective and proactive solutions.
When analyzing your data, another important factor is looking at that data as a whole as well as in certain cohorts to determine where significance lies. Your categories could include the following:
- Customers who are less than a year old and have versus have not churned
- Customers who are more than a year old and have versus have not churned
- Customers who have expanded versus those who haven’t
- Customers who have churned versus who haven’t
This analysis will help highlight statistically significant differences in behavior and associated data trends between customers who have already churned, customers who have already expanded and customers who have renewed. These insights can help you determine whether a customer who has not yet churned or not yet expanded is likely to.
4. Select Your Leading Indicators
You should have one primary indicator of customer health and happiness. Yes, just one! Usually, this primary indicator is something very important that is directly tied to your value proposition. Usage, ROI, Transactions Completed and Time to Value are often the biggest indicators of health. Whichever one you choose, this primary metric will be your make-or-break score; if a customer does not have this metric in the green, they cannot achieve a score higher than yellow.
You should also determine one secondary indicator of customer health. This secondary indicator is usually the one that moves the needle, but not as much as your primary indicator. This secondary metric must also be green to produce an overall green score.
Finally, choose one or two tertiary indicators as additional metrics to provide insight into the customer’s overall performance with the product. Often, this is a lower-value metric, such as the customer’s time on site, user adoption or impressions. These indicators help provide more context about whether a customer is performing poorly on one of the leading health indicators.
5. Build A Weighted Framework
There are many different methods of weighing your customer score. As your selection will likely depend on the maturity of your data model, some leaders choose to begin with unweighted scoring. Keep in mind: this method may blind your team to what’s actually happening with your customers. Instead, we recommend one of the following customer scoring models: all-or-none or weighted.
An all-or-none score is a great way to identify risk. With all-or-none customer scoring, the customer’s overall score is equal to the lowest score on their card, no matter how many greens, yellows or reds the customer has. For example, the customer below would have an overall Red score even though ¾ of their card is green:
- Risk = Red
- Value = Green
- Engagement = Green
- Quantitative / Product = Green → Overall = Red
This method ensures that you will always see risk. However, if your customer team is working towards the goal of improving overall value, this method can create a lot of red scores on your scorecard.
The second method is weighted scoring; with this approach, you weigh your scores based on different attributes, with more weight put on critical scores (see tip 4) for the customer’s point in their journey (see tip 1). This method can be useful in determining risk, but be aware that creating an accurate weighing system can be challenging and some issues may be masked entirely. For example, if a customer is early in their journey and has been disengaged for a long period of time but their overall score is green, your team member may accidentally overlook this:
- Risk = Green
- Value = Green
- Engagement = Red
- Quantitative / Product = Green → Overall = Green
While both methods have their benefits and drawbacks, all-or-none and weighted customer scoring methods can be extremely powerful when employed correctly. If your organization is investing in machine learning, you can also consider building a more complex weighting model.
Next Level: Design Playbooks That Address Your Data Discoveries
To build a truly predictive customer health scoring strategy, you have to take action on these insights! Design a few outcome-based playbooks for your team to run when customer scores are low. Tracking these scores is only half the battle; the real value comes from having an improvement plan and acting on it proactively. These playbooks can include simple tasks such as “Re-engage the Sales team” if engagement scores drop, or more complex tasks, such as “Audit customer value” if value scores dip. Ultimately, these playbooks help ensure that your team will be able to stay focused on what matters and avoid over- or under-rotating on a customer problem that has arisen, empowering your team to appropriately mitigate risk.
Unlock Your Potential Through Data
The success of your recurring revenue organization is directly correlated to the success of your customers. In turn, their success is dependent on your capacity to deliver relevant and timely solutions to their problems. Developing a predictive customer health scoring strategy immensely improves your ability to do so. By gathering the most relevant data, designing a hypothesis, and building a weighted framework for your leading indicators, you will be empowered with the insights you need to serve your customers effectively for maximum value realization.
Operating a data-driven engine is a continuous cycle that requires continual testing and improvements. To determine whether your customer health scoring strategy is providing consistent value to your company and customers, run it through the 5 stages of the operational improvement cycle to maximize efficiency and effectiveness.