
A Cross-Functional Approach To Churn Prediction
Most organizations have a plethora of customer data, but only a few excel at cutting-edge Customer Intelligence.
In order to create a true 360-degree view of your customers and produce predictive and actionable customer insights, you need to leverage all the rich data that exists in your organizational ecosystem. From Support data and usage data to your organizational milestones and client relationships, your organization is chock full of powerful insights that can help you with churn prediction, spotting at-risk customers and identifying upsell and cross-sell opportunities.
As prescribed by the ValueXperience framework, a customer lifecycle that is not driven by a united approach to Customer Intelligence will increase risk of customer churn, decreasing your potential to drive best-in-class Net Dollar Retention (NDR).
In this article, leaders from involve.ai, a leading Customer Intelligence Platform, share 4 often overlooked churn indicators that may be hiding in your customer data.
1. Support Ecosystem Data
While many companies ignore Support issues once they’re resolved, this data source can provide valuable information about your customers. Support tickets generate strong insights into customer sentiment, product assessment, and any adoption issues. In fact, the amount of Support tickets you receive per client is also incredibly insightful to understanding your clients and churn prediction.
Samuya Bhatnagar, involve.ai’s Chief Product Officer and Co-Founder, has seen an interesting pattern in some organizations; “Often, a company will attribute a high volume of Support tickets to customer dissatisfaction; we have actually seen the opposite. In our experience, customers with high Support tickets are active and engaged, while customers with low Support tickets have churned or are more likely to churn,” Saumya notes.
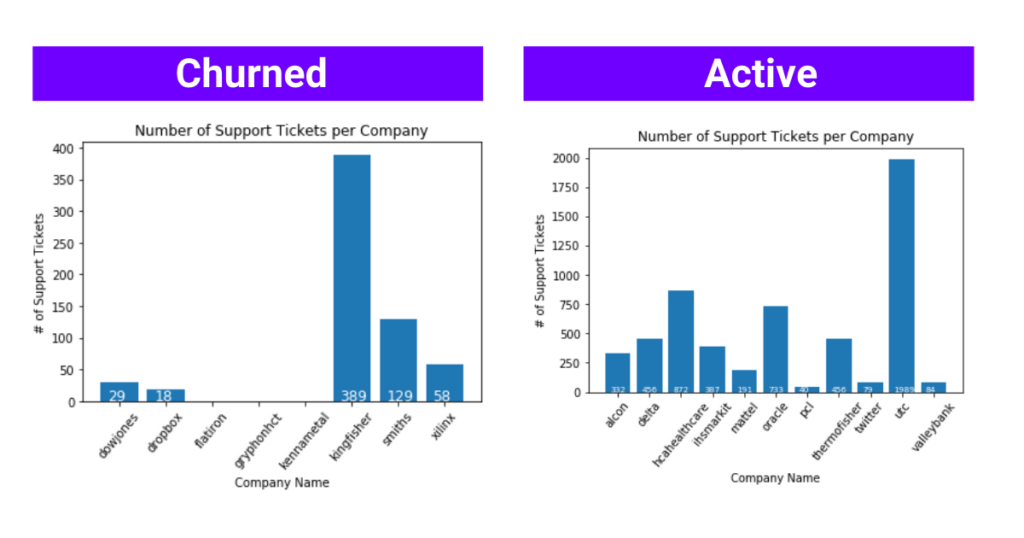
The graphic above features Support data from one of involve.ai’s top clients after 4 months of usage. The data shows that the client’s churned customers have submitted significantly less Support tickets than the active ones. That is, these tickets reflected customers’ engagement and commitment to the product/service. Digging further into this data, involve.ai found that a large volume of Support tickets with low to medium severity signaled that customers actually cared and wanted to use the product better, whereas high severity tickets signified issues with product usability. This example highlights the importance of diving deep into your Support data to determine what it signifies about your customers.
This is just one example of how your Support data can be leveraged for churn prediction and to give you more robust customer insights. By taking stock of your Support information, you can better understand your customer engagement patterns and their sentiment.
Each dataset tells a unique story. Some insights are true in certain scenarios, but might not be relevant in others. A good rule of thumb when gathering your most relevant data is to evaluate Pirate Metrics – AARRR. This metric covers data throughout the customer journey, from acquisition, activation, retention, referral, and revenue. Analyzing this data set as a whole will give your company the most accurate churn prediction insights and a 360 view of your customers.
2. Your Organizational Milestones
One milestone that companies hope to achieve quickly with customers is the First Time-to-Value mark. However, involve.ai’s Chief Strategy & Customer Officer, Mary Poppen, stresses the importance of keeping your customers’ goals in focus.
“One surprising place churn was hiding for a client I recently worked with was in the First-Time-to-Value measure. Surprising, right?! In general, we have always heard that the faster this milestone is hit, the greater your chance to land and enable expansion opportunities, referenceability and overall NRR growth,” Mary explained.
Even as a seasoned Customer Success leader who’s worked for leading tech companies such as Glint and LinkedIn, Mary admitted to being initially puzzled by this client’s situation. How was it possible that a client was experiencing increased churn while customers experienced faster Time-to-First-Value?
After digging into this further, she found that this client’s onboarding team was incentivized to get customers ready as quickly as possible. “As it turns out,” Mary continued, “customers were getting set up quickly, but the set up had little to do with their business goals and desired outcomes as well as little time for change management internally. The big “Ah-Ha” for this company was to determine Optimal Time to First Value vs. simply focusing on how fast they could get a customer live on the product.”
Ultimately, Mary discovered that it’s not about how fast you can get customers through the onboarding process, but how quickly you can help customers reach their goals with your product. So, while hitting your own organizational milestones is essential to the success of your company’s growth, it’s even more important to keep your eye on the prize: driving value for your customers.
3. Indirect Usage Data
While some leaders focus on specific metrics, such as logins, these measures only give you a small piece of the picture and are not accurate indicators of adoption or churn prediction.
Instead, focusing on your product differentiation features may actually provide more insight into your customer’s adoption of your product. For instance, if your product differentiation features are under-utilized, you could be on the fast track to high churn because your customers aren’t getting anything different out of your product and can easily switch to your competitors. “The data you have on your differentiation features is critical for product development and keeping you competitive in the market,” says involve.ai’s Director of Product, Hardika Narula. “These are the numbers you will leverage and lean on when business decisions are being reviewed, so consistent adoption and stickiness of your key features are an absolute must.”
When it comes to evaluating customer health and churn prediction, here are the top 9 KPIs that all CS teams should be tracking:
- Product Usage
- NPS/CSAT
- Interaction Frequency
- Support Tickets
- The severity of Support Tickets
- Upsells/Downsells
- Customer Maturity
- Renewal Sentiment
- Customer Owner Pulse
Check out The Ultimate Guide to Customer Health for more detail.
4. Client Relationships
Involve.ai’s Chief Strategy & Customer Officer, Mary Poppen also notes that churn can hide within your client relationships. “When you have a strong relationship with the Project Manager or Admin, that’s great! However, do you have a good relationship with the Decision Maker? A mistake that is often made is thinking a customer is healthy and will renew without knowledge of the Decision Maker’s perception of the value you are providing in the partnership.”
Mary, who is a customer experience advisor on various boards with a long career in enhancing customer relationships, has unfortunately seen this miscalculation more than once. Your Customer Success reps can have the best interactions with their clients – weekly check-ins, ROI meetings, the works – but if the Decision Maker is not part of any of it, you leave yourself vulnerable to losing that client. To combat this, Mary suggests you “make sure you have a multi-threaded approach to relationships with your customers or you may be surprised by a churn from a ‘happy’ customer.”
Understanding Your Data From A-Z
As customers churn, many companies focus heavily on the Post-Sales experience. This strategy only works if you know your data extremely well. However, this approach still leaves room for observer bias. According to Saumya, “when looking for the root causes of churn, organizations will implement preset questions and metrics that they are specifically searching for, which hinders them from uncovering the actual reasons for churn. In other words, you don’t know what you don’t know.”
Therefore, it’s important to remember to look at your data holistically and evaluate the entire customer journey from the first point of interaction to renewal for stronger reference points and a more accurate picture for churn prediction.
There are 3 critical points along your customer journey that you must take into account when evaluating your customer data for churn prediction:
- Moment of Value Perception
- Moment of Value Realization
- Moment of Value Adoption
Stay Ahead of Churn with Early Indicators
Evaluating both qualitative and quantitative data from your cross-functional teams play a vital role in the creation of robust and effective churn triggers. By expanding the scope of your data pool and gathering data from across your organization, you can gather cutting-edge Customer Intelligence and obtain a 360 degree view of your customers that will empower your teams to proactively predict and prevent churn, thereby maximizing revenue retention and expansion.
Related posts:
 Building A Data-Driven Customer Success Operations Model: An Interview With Mathieu Brillon
 The 3 Fundamental Customer Success Metrics That C-Suite Leadership Should be Tracking
 5 Essential Data Sources For Customer Success Teams
 Scaling Customer Success With The Right Team, Technology And Data Processes: An Interview With Stephen Keogh